
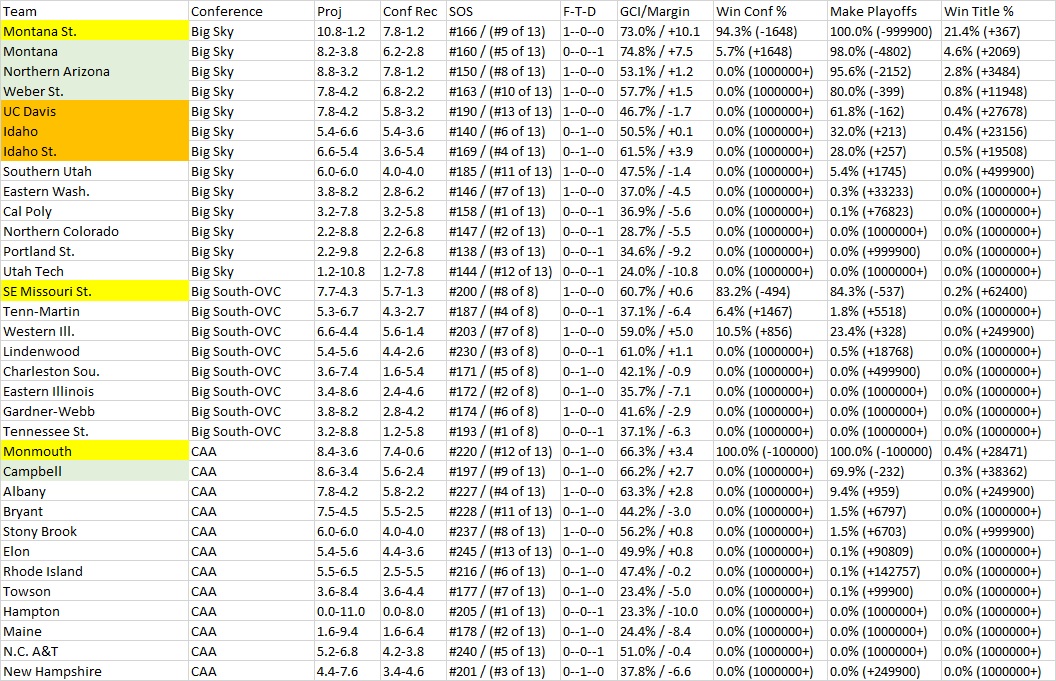
Below are projected standings and chances of each team winning their conference and making the playoffs. Right now auto bid projections are:
- Big Sky — Montana State
- CAA — Monmouth
- Ivy — Harvard
- MVFC — South Dakota St.
- NEC — Central Connecticut State
- OVC — Southeast Missouri State
- Patriot — Lehigh
- Pioneer — Dayton
- SoCon — Mercer
- Southland — Lamar
- UAC — Tarleton State
- At large teams (showing >50% odds to currently make playoff: Montana, Northern Arizona, Weber St., Campbell, Youngstown St., South Dakota, North Dakota, Illinois St., ETSU, Tennessee Tech, Stephen F. Austin, Incarnate Word, & Austin Peay.
- A few of these teams could sneak in depending on this week’s results. UC Davis, Idaho, Idaho St. & Abilene Christian.
Headings explained: SOS is listed as OVERALL then if in conference their rank of games against just conference opponents. For example 6/8. GCI index/Margin is how long you held the lead in games and the average margin of that lead. F-T-D = games left as a favorite, tossups, dogs.
| Team | Conference | Proj | Conf Rec | SOS | F-T-D | GCI/Margin | Win Conf % | Make Playoffs | Win Title % |
| Montana St. | Big Sky | 10.8-1.2 | 7.8-1.2 | #166 / (#9 of 13) | 1–0–0 | 73.0% / +10.1 | 94.3% (-1648) | 100.0% (-999900) | 21.4% (+367) |
| Montana | Big Sky | 8.2-3.8 | 6.2-2.8 | #160 / (#5 of 13) | 0–0–1 | 74.8% / +7.5 | 5.7% (+1648) | 98.0% (-4802) | 4.6% (+2069) |
| Northern Arizona | Big Sky | 8.8-3.2 | 7.8-1.2 | #150 / (#8 of 13) | 1–0–0 | 53.1% / +1.2 | 0.0% (1000000+) | 95.6% (-2152) | 2.8% (+3484) |
| Weber St. | Big Sky | 7.8-4.2 | 6.8-2.2 | #163 / (#10 of 13) | 1–0–0 | 57.7% / +1.5 | 0.0% (1000000+) | 80.0% (-399) | 0.8% (+11948) |
| UC Davis | Big Sky | 7.8-4.2 | 5.8-3.2 | #190 / (#13 of 13) | 1–0–0 | 46.7% / -1.7 | 0.0% (1000000+) | 61.8% (-162) | 0.4% (+27678) |
| Idaho | Big Sky | 5.4-6.6 | 5.4-3.6 | #140 / (#6 of 13) | 0–1–0 | 50.5% / +0.1 | 0.0% (1000000+) | 32.0% (+213) | 0.4% (+23156) |
| Idaho St. | Big Sky | 6.6-5.4 | 3.6-5.4 | #169 / (#4 of 13) | 0–1–0 | 61.5% / +3.9 | 0.0% (1000000+) | 28.0% (+257) | 0.5% (+19508) |
| Southern Utah | Big Sky | 6.0-6.0 | 4.0-4.0 | #185 / (#11 of 13) | 1–0–0 | 47.5% / -1.4 | 0.0% (1000000+) | 5.4% (+1745) | 0.0% (+499900) |
| Eastern Wash. | Big Sky | 3.8-8.2 | 2.8-6.2 | #146 / (#7 of 13) | 1–0–0 | 37.0% / -4.5 | 0.0% (1000000+) | 0.3% (+33233) | 0.0% (1000000+) |
| Cal Poly | Big Sky | 3.2-7.8 | 3.2-5.8 | #158 / (#1 of 13) | 0–0–1 | 36.9% / -5.6 | 0.0% (1000000+) | 0.1% (+76823) | 0.0% (1000000+) |
| Northern Colorado | Big Sky | 2.2-8.8 | 2.2-6.8 | #147 / (#2 of 13) | 0–0–1 | 28.7% / -5.5 | 0.0% (1000000+) | 0.0% (1000000+) | 0.0% (1000000+) |
| Portland St. | Big Sky | 2.2-9.8 | 2.2-6.8 | #138 / (#3 of 13) | 0–0–1 | 34.6% / -9.2 | 0.0% (1000000+) | 0.0% (+999900) | 0.0% (1000000+) |
| Utah Tech | Big Sky | 1.2-10.8 | 1.2-7.8 | #144 / (#12 of 13) | 0–0–1 | 24.0% / -10.8 | 0.0% (1000000+) | 0.0% (1000000+) | 0.0% (1000000+) |
| SE Missouri St. | Big South-OVC | 7.7-4.3 | 5.7-1.3 | #200 / (#8 of 8) | 1–0–0 | 60.7% / +0.6 | 83.2% (-494) | 84.3% (-537) | 0.2% (+62400) |
| Tenn-Martin | Big South-OVC | 5.3-6.7 | 4.3-2.7 | #187 / (#4 of 8) | 0–0–1 | 37.1% / -6.4 | 6.4% (+1467) | 1.8% (+5518) | 0.0% (1000000+) |
| Western Ill. | Big South-OVC | 6.6-4.4 | 5.6-1.4 | #203 / (#7 of 8) | 1–0–0 | 59.0% / +5.0 | 10.5% (+856) | 23.4% (+328) | 0.0% (+249900) |
| Lindenwood | Big South-OVC | 5.4-5.6 | 4.4-2.6 | #230 / (#3 of 8) | 0–0–1 | 61.0% / +1.1 | 0.0% (1000000+) | 0.5% (+18768) | 0.0% (1000000+) |
| Charleston Sou. | Big South-OVC | 3.6-7.4 | 1.6-5.4 | #171 / (#5 of 8) | 0–1–0 | 42.1% / -0.9 | 0.0% (1000000+) | 0.0% (+499900) | 0.0% (1000000+) |
| Eastern Illinois | Big South-OVC | 3.4-8.6 | 2.4-4.6 | #172 / (#2 of 8) | 0–1–0 | 35.7% / -7.1 | 0.0% (1000000+) | 0.0% (1000000+) | 0.0% (1000000+) |
| Gardner-Webb | Big South-OVC | 3.8-8.2 | 2.8-4.2 | #174 / (#6 of 8) | 1–0–0 | 41.6% / -2.9 | 0.0% (1000000+) | 0.0% (1000000+) | 0.0% (1000000+) |
| Tennessee St. | Big South-OVC | 3.2-8.8 | 1.2-5.8 | #193 / (#1 of 8) | 0–0–1 | 37.1% / -6.3 | 0.0% (1000000+) | 0.0% (1000000+) | 0.0% (1000000+) |
| Monmouth | CAA | 8.4-3.6 | 7.4-0.6 | #220 / (#12 of 13) | 0–1–0 | 66.3% / +3.4 | 100.0% (-100000) | 100.0% (-100000) | 0.4% (+28471) |
| Campbell | CAA | 8.6-3.4 | 5.6-2.4 | #197 / (#9 of 13) | 0–1–0 | 66.2% / +2.7 | 0.0% (1000000+) | 69.9% (-232) | 0.3% (+38362) |
| Albany | CAA | 7.8-4.2 | 5.8-2.2 | #227 / (#4 of 13) | 1–0–0 | 63.3% / +2.8 | 0.0% (1000000+) | 9.4% (+959) | 0.0% (+249900) |
| Bryant | CAA | 7.5-4.5 | 5.5-2.5 | #228 / (#11 of 13) | 0–1–0 | 44.2% / -3.0 | 0.0% (1000000+) | 1.5% (+6797) | 0.0% (1000000+) |
| Stony Brook | CAA | 6.0-6.0 | 4.0-4.0 | #237 / (#8 of 13) | 1–0–0 | 56.2% / +0.8 | 0.0% (1000000+) | 1.5% (+6703) | 0.0% (+999900) |
| Elon | CAA | 5.4-5.6 | 4.4-3.6 | #245 / (#13 of 13) | 0–1–0 | 49.9% / +0.8 | 0.0% (1000000+) | 0.1% (+90809) | 0.0% (1000000+) |
| Rhode Island | CAA | 5.5-6.5 | 2.5-5.5 | #216 / (#6 of 13) | 0–1–0 | 47.4% / -0.2 | 0.0% (1000000+) | 0.1% (+142757) | 0.0% (1000000+) |
| Towson | CAA | 3.6-8.4 | 3.6-4.4 | #177 / (#7 of 13) | 0–1–0 | 23.4% / -5.0 | 0.0% (1000000+) | 0.1% (+99900) | 0.0% (1000000+) |
| Hampton | CAA | 0.0-11.0 | 0.0-8.0 | #205 / (#1 of 13) | 0–0–1 | 23.3% / -10.0 | 0.0% (1000000+) | 0.0% (1000000+) | 0.0% (1000000+) |
| Maine | CAA | 1.6-9.4 | 1.6-6.4 | #178 / (#2 of 13) | 0–1–0 | 24.4% / -8.4 | 0.0% (1000000+) | 0.0% (1000000+) | 0.0% (1000000+) |
| N.C. A&T | CAA | 5.2-6.8 | 4.2-3.8 | #240 / (#5 of 13) | 0–0–1 | 51.0% / -0.4 | 0.0% (1000000+) | 0.0% (1000000+) | 0.0% (1000000+) |
| New Hampshire | CAA | 4.4-7.6 | 3.4-4.6 | #201 / (#3 of 13) | 0–1–0 | 37.8% / -6.6 | 0.0% (1000000+) | 0.0% (+249900) | 0.0% (1000000+) |
| Sacred Heart | CAA | 4.5-6.5 | 4.0-4.0 | #244 / (#10 of 13) | 0–1–0 | 46.6% / -2.7 | 0.0% (1000000+) | 0.0% (+249900) | 0.0% (1000000+) |
| Chicago St | FCS Independents | 0.0-7.0 | 0.0-0.0 | #226 | 0–0–1 | 35.0% / -2.3 | 100.0% (-100000) | 0.0% (1000000+) | |
| Merrimack | FCS Independents | 5.5-6.5 | 0.0-0.0 | #182 | 0–1–0 | 38.1% / -6.7 | 100.0% (-100000) | 0.0% (1000000+) | 0.0% (1000000+) |
| Harvard | Ivy | 8.7-1.3 | 5.7-1.3 | #215 / (#8 of 8) | 1–0–0 | 73.2% / +8.1 | 100.0% (-100000) | 100.0% (-100000) | 1.8% (+5364) |
| Brown | Ivy | 6.5-3.5 | 4.5-2.5 | #223 / (#6 of 8) | 0–1–0 | 54.1% / +1.7 | 0.0% (1000000+) | 3.2% (+3006) | 0.0% (1000000+) |
| Yale | Ivy | 5.3-4.7 | 3.3-3.7 | #212 / (#7 of 8) | 0–0–1 | 54.9% / +1.7 | 0.0% (1000000+) | 2.9% (+3313) | 0.1% (+166567) |
| Princeton | Ivy | 6.6-3.4 | 4.6-2.4 | #218 / (#3 of 8) | 0–1–0 | 59.7% / +2.7 | 0.0% (1000000+) | 1.3% (+7774) | 0.0% (+999900) |
| Cornell | Ivy | 4.6-5.4 | 2.6-4.4 | #195 / (#4 of 8) | 1–0–0 | 65.3% / +2.5 | 0.0% (1000000+) | 0.1% (+142757) | 0.0% (1000000+) |
| Columbia | Ivy | 4.4-5.6 | 1.4-5.6 | #219 / (#1 of 8) | 0–0–1 | 31.0% / -6.8 | 0.0% (1000000+) | 0.0% (+333233) | 0.0% (1000000+) |
| Dartmouth | Ivy | 4.5-5.5 | 3.5-3.5 | #191 / (#5 of 8) | 0–1–0 | 48.6% / -0.5 | 0.0% (1000000+) | 0.0% (1000000+) | 0.0% (1000000+) |
| Pennsylvania | Ivy | 4.4-5.6 | 2.4-4.6 | #204 / (#2 of 8) | 0–1–0 | 36.8% / -2.1 | 0.0% (1000000+) | 0.0% (1000000+) | 0.0% (1000000+) |
| S. Carolina St. | MEAC | 7.8-2.2 | 4.8-0.2 | #250 / (#6 of 6) | 1–0–0 | 77.1% / +11.6 | 100.0% (-100000) | 0.0% (1000000+) | |
| Delaware St. | MEAC | 4.2-5.8 | 2.2-2.8 | #207 / (#4 of 6) | 0–0–1 | 44.3% / -2.9 | 0.0% (1000000+) | 0.0% (1000000+) | |
| Howard | MEAC | 4.4-6.6 | 2.4-2.6 | #176 / (#1 of 6) | 0–1–0 | 32.1% / -8.5 | 0.0% (1000000+) | 0.0% (1000000+) | |
| Morgan St. | MEAC | 5.4-5.6 | 1.4-3.6 | #224 / (#3 of 6) | 0–0–1 | 45.5% / -2.1 | 0.0% (1000000+) | 0.0% (1000000+) | |
| N.C. Central | MEAC | 4.6-6.4 | 3.6-1.4 | #232 / (#5 of 6) | 1–0–0 | 51.1% / -0.1 | 0.0% (1000000+) | 0.0% (1000000+) | |
| Norfolk St. | MEAC | 2.6-7.4 | 0.6-4.4 | #239 / (#2 of 6) | 0–1–0 | 55.1% / +3.3 | 0.0% (1000000+) | 0.0% (1000000+) | |
| South Dakota St. | MVFC | 10.0-2.0 | 7.0-1.0 | #170 / (#9 of 9) | 1–0–0 | 76.9% / +13.2 | 100.0% (-100000) | 100.0% (-100000) | 18.6% (+437) |
| Youngstown St. | MVFC | 8.0-3.0 | 6.0-2.0 | #152 / (#8 of 9) | 0–0–0 | 62.0% / +7.6 | 0.0% (1000000+) | 99.4% (-15773) | 7.3% (+1272) |
| South Dakota | MVFC | 8.6-3.4 | 5.6-2.4 | #148 / (#7 of 9) | 0–1–0 | 67.8% / +6.9 | 0.0% (1000000+) | 97.2% (-3459) | 6.3% (+1495) |
| North Dakota | MVFC | 7.8-4.2 | 4.8-3.2 | #154 / (#6 of 9) | 1–0–0 | 65.8% / +7.3 | 0.0% (1000000+) | 89.5% (-849) | 3.9% (+2458) |
| Illinois St. | MVFC | 7.4-3.6 | 4.4-3.6 | #153 / (#5 of 9) | 0–1–0 | 62.6% / +8.1 | 0.0% (1000000+) | 74.8% (-296) | 1.4% (+7253) |
| Southern Ill. | MVFC | 5.2-6.8 | 3.2-4.8 | #142 / (#4 of 9) | 0–0–1 | 39.9% / -3.6 | 0.0% (1000000+) | 6.8% (+1373) | 0.1% (+166567) |
| Northern Iowa | MVFC | 4.8-6.2 | 3.8-4.2 | #145 / (#3 of 9) | 1–0–0 | 46.7% / -3.0 | 0.0% (1000000+) | 5.3% (+1783) | 0.1% (+83233) |
| Indiana St. | MVFC | 2.0-10.0 | 0.0-8.0 | #151 / (#2 of 9) | 0–0–1 | 28.9% / -6.5 | 0.0% (1000000+) | 0.0% (1000000+) | 0.0% (1000000+) |
| Murray St. | MVFC | 2.2-9.8 | 1.2-6.8 | #141 / (#1 of 9) | 0–0–1 | 31.4% / -9.9 | 0.0% (1000000+) | 0.0% (1000000+) | 0.0% (1000000+) |
| Central Conn. St. | NEC | 5.7-4.3 | 5.7-1.3 | #238 / (#8 of 8) | 1–0–0 | 61.5% / +3.9 | 72.4% (-262) | 89.3% (-836) | 0.0% (+499900) |
| Robert Morris | NEC | 5.6-5.4 | 4.6-2.4 | #253 / (#6 of 8) | 0–1–0 | 62.0% / +0.2 | 16.5% (+506) | 0.0% (1000000+) | 0.0% (1000000+) |
| Long Island | NEC | 4.4-7.6 | 4.4-2.6 | #222 / (#4 of 8) | 0–1–0 | 26.7% / -8.3 | 11.1% (+798) | 10.7% (+836) | 0.0% (1000000+) |
| Mercyhurst | NEC | 0.6-10.4 | 0.6-6.4 | #213 / (#3 of 8) | 0–1–0 | 26.6% / -10.0 | 0.0% (1000000+) | 0.0% (1000000+) | |
| Duquesne | NEC | 4.3-5.7 | 4.3-2.7 | #234 / (#7 of 8) | 0–0–1 | 45.4% / -4.2 | 0.0% (1000000+) | 0.0% (+499900) | 0.0% (1000000+) |
| New Haven | NEC | 3.4-8.6 | 2.4-4.6 | #247 / (#2 of 8) | 0–1–0 | 18.0% / -9.7 | 0.0% (1000000+) | 0.0% (1000000+) | 0.0% (1000000+) |
| Stonehill | NEC | 4.8-7.2 | 3.8-3.2 | #249 / (#5 of 8) | 1–0–0 | 45.9% / -0.7 | 0.0% (1000000+) | 0.0% (1000000+) | 0.0% (1000000+) |
| Wagner | NEC | 2.2-8.8 | 2.2-4.8 | #236 / (#1 of 8) | 0–0–1 | 36.2% / -9.0 | 0.0% (1000000+) | 0.0% (1000000+) | 0.0% (1000000+) |
| Lehigh | Patriot | 9.8-2.2 | 7.8-1.2 | #235 / (#10 of 10) | 1–0–0 | 64.7% / +7.4 | 100.0% (-100000) | 100.0% (-100000) | 1.8% (+5364) |
| Villanova | Patriot | 6.9-5.1 | 5.9-3.1 | #210 / (#9 of 10) | 1–0–0 | 57.8% / +2.2 | 0.0% (1000000+) | 11.9% (+743) | 0.1% (+71329) |
| Colgate | Patriot | 6.9-5.1 | 5.9-3.1 | #206 / (#8 of 10) | 1–0–0 | 69.2% / +5.1 | 0.0% (1000000+) | 3.6% (+2640) | 0.0% (+499900) |
| Richmond | Patriot | 6.8-5.2 | 4.8-4.2 | #211 / (#7 of 10) | 1–0–0 | 60.7% / -1.9 | 0.0% (1000000+) | 1.4% (+7146) | 0.0% (1000000+) |
| Holy Cross | Patriot | 6.7-5.3 | 6.7-2.3 | #199 / (#6 of 10) | 1–0–0 | 42.9% / -2.6 | 0.0% (1000000+) | 1.1% (+8750) | 0.0% (1000000+) |
| Lafayette | Patriot | 4.7-7.3 | 3.7-5.3 | #225 / (#5 of 10) | 0–1–1 | 31.3% / -6.5 | 0.0% (1000000+) | 0.1% (+76823) | 0.0% (1000000+) |
| Bucknell | Patriot | 1.1-10.9 | 0.1-8.9 | #208 / (#1 of 10) | 0–0–1 | 18.9% / -10.1 | 0.0% (1000000+) | 0.0% (1000000+) | 0.0% (1000000+) |
| Fordham | Patriot | 4.3-7.7 | 4.3-4.7 | #180 / (#4 of 10) | 0–0–1 | 39.6% / -3.9 | 0.0% (1000000+) | 0.0% (1000000+) | 0.0% (1000000+) |
| Georgetown | Patriot | 3.6-7.4 | 3.6-5.4 | #229 / (#3 of 10) | 0–1–1 | 35.7% / -5.0 | 0.0% (1000000+) | 0.0% (1000000+) | 0.0% (1000000+) |
| William & Mary | Patriot | 4.2-7.8 | 2.2-6.8 | #198 / (#2 of 10) | 0–0–1 | 41.6% / -6.6 | 0.0% (1000000+) | 0.0% (+499900) | 0.0% (1000000+) |
| Dayton | Pioneer | 7.8-1.2 | 6.8-1.2 | #266 / (#11 of 11) | 1–0–0 | 73.2% / +6.2 | 83.4% (-504) | 83.6% (-511) | 0.0% (+999900) |
| Butler | Pioneer | 7.9-2.1 | 6.9-1.1 | #262 / (#2 of 11) | 1–0–0 | 65.6% / +6.8 | 16.6% (+504) | 16.7% (+497) | 0.0% (1000000+) |
| St. Thomas | Pioneer | 6.7-3.3 | 5.7-2.3 | #260 / (#9 of 11) | 1–0–0 | 64.2% / +6.3 | 0.0% (1000000+) | 0.8% (+12400) | 0.0% (1000000+) |
| Davidson | Pioneer | 3.2-6.8 | 2.2-5.8 | #264 / (#5 of 11) | 0–0–1 | 30.1% / -8.2 | 0.0% (1000000+) | 0.0% (1000000+) | 0.0% (1000000+) |
| Drake | Pioneer | 3.0-7.0 | 3.0-5.0 | #256 / (#1 of 11) | 0–0–0 | 41.4% / -4.3 | 0.0% (1000000+) | 0.0% (1000000+) | 0.0% (1000000+) |
| Marist | Pioneer | 4.8-6.2 | 4.8-3.2 | #265 / (#10 of 11) | 1–0–0 | 51.6% / +0.9 | 0.0% (1000000+) | 0.0% (1000000+) | 0.0% (1000000+) |
| Morehead St. | Pioneer | 2.1-7.9 | 2.1-5.9 | #261 / (#8 of 11) | 0–0–1 | 46.0% / -2.2 | 0.0% (1000000+) | 0.0% (1000000+) | 0.0% (1000000+) |
| Presbyterian | Pioneer | 3.2-6.8 | 3.2-4.8 | #259 / (#7 of 11) | 0–0–1 | 36.0% / -6.8 | 0.0% (1000000+) | 0.0% (1000000+) | 0.0% (1000000+) |
| San Diego | Pioneer | 5.9-5.1 | 4.9-3.1 | #257 / (#4 of 11) | 1–0–0 | 47.3% / -2.9 | 0.0% (1000000+) | 0.0% (+333233) | 0.0% (1000000+) |
| Stetson | Pioneer | 0.1-10.9 | 0.1-7.9 | #258 / (#6 of 11) | 0–0–1 | 25.8% / -12.0 | 0.0% (1000000+) | 0.0% (1000000+) | 0.0% (1000000+) |
| Valparaiso | Pioneer | 4.3-5.7 | 4.3-3.7 | #263 / (#3 of 11) | 0–0–1 | 46.6% / +1.4 | 0.0% (1000000+) | 0.0% (1000000+) | 0.0% (1000000+) |
| Mercer | Southern | 9.6-2.4 | 6.6-1.4 | #209 / (#7 of 10) | 1–0–0 | 65.9% / +6.3 | 62.8% (-169) | 79.7% (-392) | 0.7% (+14186) |
| East Tennessee State | Southern | 6.4-4.6 | 5.4-2.6 | #189 / (#5 of 10) | 0–0–1 | 63.2% / +3.8 | 37.2% (+169) | 38.6% (+159) | 0.1% (+90809) |
| Tennessee Tech | Southern | 9.0-3.0 | 7.0-1.0 | #192 / (#9 of 10) | 0–0–1 | 62.9% / +6.4 | 0.0% (1000000+) | 94.2% (-1612) | 1.9% (+5276) |
| Western Carolina | Southern | 6.8-5.2 | 4.8-3.2 | #181 / (#1 of 10) | 1–0–0 | 55.1% / -0.8 | 0.0% (1000000+) | 12.6% (+694) | 0.1% (+142757) |
| Chattanooga | Southern | 7.0-5.0 | 6.0-2.0 | #183 / (#9 of 10) | 0–0–1 | 64.0% / +4.2 | 0.0% (1000000+) | 4.3% (+2242) | 0.1% (+166567) |
| Wofford | Southern | 5.0-7.0 | 3.0-5.0 | #173 / (#7 of 10) | 0–0–1 | 64.9% / +2.9 | 0.0% (1000000+) | 0.2% (+49900) | 0.0% (1000000+) |
| Citadel | Southern | 3.2-8.8 | 1.2-6.8 | #161 / (#3 of 10) | 0–0–1 | 31.5% / -5.7 | 0.0% (1000000+) | 0.0% (1000000+) | 0.0% (1000000+) |
| Furman | Southern | 2.9-8.1 | 2.9-5.1 | #168 / (#5 of 10) | 1–0–0 | 22.0% / -6.0 | 0.0% (1000000+) | 0.0% (1000000+) | 0.0% (1000000+) |
| Samford | Southern | 4.0-8.0 | 4.0-4.0 | #157 / (#4 of 10) | 0–0–1 | 33.2% / -3.3 | 0.0% (1000000+) | 0.0% (+999900) | 0.0% (1000000+) |
| Virginia Military | Southern | 0.1-11.9 | 0.1-7.9 | #196 / (#2 of 10) | 0–0–1 | 22.2% / -14.3 | 0.0% (1000000+) | 0.0% (1000000+) | 0.0% (1000000+) |
| Lamar | Southland | 9.8-2.2 | 7.8-1.2 | #186 / (#9 of 10) | 1–0–0 | 78.1% / +8.2 | 80.4% (-410) | 95.7% (-2242) | 2.1% (+4617) |
| Stephen F. Austin | Southland | 10.0-1.0 | 8.0-1.0 | #221 / (#10 of 10) | 1–0–0 | 85.0% / +15.3 | 19.6% (+410) | 99.8% (-52532) | 9.0% (+1006) |
| Incarnate Word | Southland | 6.8-4.2 | 6.8-2.2 | #175 / (#8 of 10) | 1–0–0 | 59.0% / +7.1 | 0.0% (1000000+) | 51.0% (-104) | 0.4% (+23156) |
| SE Louisiana | Southland | 5.8-6.2 | 3.8-5.2 | #188 / (#6 of 10) | 1–0–0 | 47.3% / -0.1 | 0.0% (1000000+) | 4.5% (+2117) | 0.0% (+999900) |
| Texas Rio Grande Valley | Southland | 4.6-6.4 | 3.6-5.4 | #184 / (#7 of 10) | 1–0–0 | 40.8% / -2.6 | 0.0% (1000000+) | 0.8% (+13233) | 0.0% (+999900) |
| Houston Christian | Southland | 4.4-6.6 | 4.4-4.6 | #167 / (#4 of 10) | 0–0–1 | 43.6% / +1.4 | 0.0% (1000000+) | 0.2% (+62400) | 0.0% (1000000+) |
| East Texas A&M | Southland | 3.2-8.8 | 3.2-5.8 | #179 / (#3 of 10) | 0–0–1 | 37.0% / -4.9 | 0.0% (1000000+) | 0.0% (1000000+) | 0.0% (1000000+) |
| McNeese St. | Southland | 4.2-6.8 | 4.2-4.8 | #156 / (#5 of 10) | 0–0–1 | 47.8% / -2.0 | 0.0% (1000000+) | 0.0% (+499900) | 0.0% (1000000+) |
| Nicholls St. | Southland | 4.2-7.8 | 3.2-5.8 | #194 / (#2 of 10) | 0–0–1 | 28.6% / -10.0 | 0.0% (1000000+) | 0.0% (+333233) | 0.0% (1000000+) |
| Northwestern St. | Southland | 0.0-11.0 | 0.0-9.0 | #162 / (#1 of 10) | 0–0–1 | 18.1% / -17.6 | 0.0% (1000000+) | 0.0% (1000000+) | 0.0% (1000000+) |
| Alabama A&M | SWAC | 6.9-3.1 | 5.9-2.1 | #254 / (#11 of 12) | 1–0–0 | 81.0% / +11.5 | 50.2% (-101) | 0.0% (1000000+) | |
| Prairie View A&M | SWAC | 6.5-5.5 | 5.5-2.5 | #214 / (#8 of 12) | 0–1–0 | 54.0% / -0.4 | 26.3% (+280) | 0.0% (1000000+) | |
| Alabama St. | SWAC | 5.5-4.5 | 4.5-3.5 | #252 / (#9 of 12) | 0–1–0 | 53.8% / +1.8 | 20.8% (+382) | 0.0% (1000000+) | |
| Jackson St. | SWAC | 5.6-3.4 | 4.6-3.4 | #255 / (#12 of 12) | 0–1–0 | 59.0% / +6.1 | 1.9% (+5276) | 0.0% (1000000+) | |
| Southern | SWAC | 4.5-5.5 | 4.5-3.5 | #242 / (#5 of 12) | 0–1–0 | 55.1% / -0.4 | 0.4% (+28471) | 0.0% (1000000+) | |
| AR Pine Bluff | SWAC | 4.6-4.4 | 4.6-3.4 | #243 / (#7 of 12) | 1–0–0 | 63.3% / +4.9 | 0.4% (+27678) | 0.0% (1000000+) | |
| Alcorn St. | SWAC | 4.4-5.6 | 4.4-3.6 | #248 / (#10 of 12) | 0–1–0 | 53.2% / +3.4 | 0.2% (+58724) | 0.0% (1000000+) | |
| Bethune-Cookman | SWAC | 4.5-6.5 | 3.5-4.5 | #246 / (#6 of 12) | 0–1–0 | 38.5% / -8.4 | 0.0% (1000000+) | 0.0% (1000000+) | |
| Florida A&M | SWAC | 2.5-8.5 | 2.5-5.5 | #231 / (#4 of 12) | 0–1–0 | 35.7% / -7.7 | 0.0% (1000000+) | 0.0% (1000000+) | |
| Grambling St. | SWAC | 3.5-5.5 | 3.5-4.5 | #233 / (#1 of 12) | 0–1–0 | 54.9% / +0.6 | 0.0% (1000000+) | 0.0% (1000000+) | |
| Miss. Valley St. | SWAC | 2.1-7.9 | 2.1-5.9 | #251 / (#2 of 12) | 0–0–1 | 25.8% / -11.3 | 0.0% (1000000+) | 0.0% (1000000+) | |
| Texas Southern | SWAC | 3.4-7.6 | 2.4-5.6 | #241 / (#3 of 12) | 0–0–1 | 30.9% / -10.0 | 0.0% (1000000+) | 0.0% (1000000+) | |
| Tarleton State | UAC | 11.8-0.2 | 6.8-0.2 | #217 / (#8 of 8) | 1–0–0 | 86.8% / +10.0 | 100.0% (-100000) | 100.0% (-100000) | 9.6% (+947) |
| West Florida | UAC | 3.7-5.3 | 1.7-5.3 | #164 / (#3 of 8) | 1–0–0 | 43.3% / -1.1 | 0.0% (1000000+) | 0.0% (1000000+) | |
| West Georgia | UAC | 0.3-10.7 | 0.3-6.7 | #149 / (#1 of 8) | 0–0–1 | 30.1% / -8.4 | 0.0% (1000000+) | 0.0% (1000000+) | |
| Austin Peay | UAC | 8.8-3.2 | 4.8-2.2 | #202 / (#7 of 8) | 1–0–0 | 65.1% / +6.6 | 0.0% (1000000+) | 85.6% (-596) | 2.1% (+4662) |
| Abilene Christian | UAC | 6.8-5.2 | 5.8-1.2 | #143 / (#6 of 8) | 1–0–0 | 41.6% / +0.3 | 0.0% (1000000+) | 28.3% (+253) | 0.4% (+25541) |
| North Alabama | UAC | 7.2-4.8 | 4.2-2.8 | #165 / (#5 of 8) | 0–0–1 | 59.5% / +1.8 | 0.0% (1000000+) | 10.8% (+827) | 0.2% (+55456) |
| Central Arkansas | UAC | 3.2-7.8 | 2.2-4.8 | #155 / (#4 of 8) | 0–0–1 | 29.2% / -4.1 | 0.0% (1000000+) | 0.1% (+71329) | 0.0% (1000000+) |
| Eastern Kentucky | UAC | 3.2-8.8 | 2.2-4.8 | #159 / (#2 of 8) | 0–0–1 | 40.2% / -4.8 | 0.0% (1000000+) | 0.0% (+999900) | 0.0% (1000000+) |