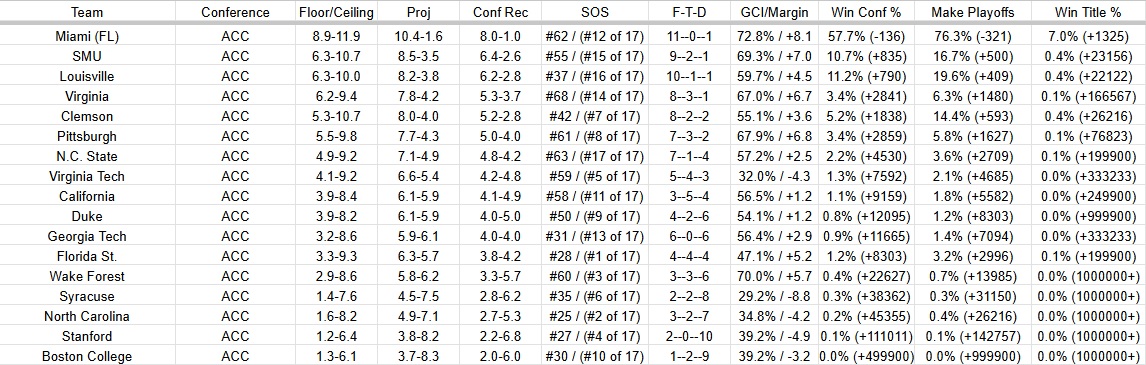
ACC pre-season chart based on my updated numbers.
Column headings are team, conf, floor/ceiling based on opponent’s rankings, Proj is projected W/L for season. Conf Rec is projected conf record. SOS lists overall then within the conference #1 is toughest schedule, higher number is easier schedule.
F-T-D = F favorite >60% games, T= Tossup between 40%-59.99% games. D=dog less than 40% chance of winning those games. GCI = game control index. how long they led/tied throughout the season and the avg margin they held. then their chances of winning the conf, make the playoffs and win the national title.