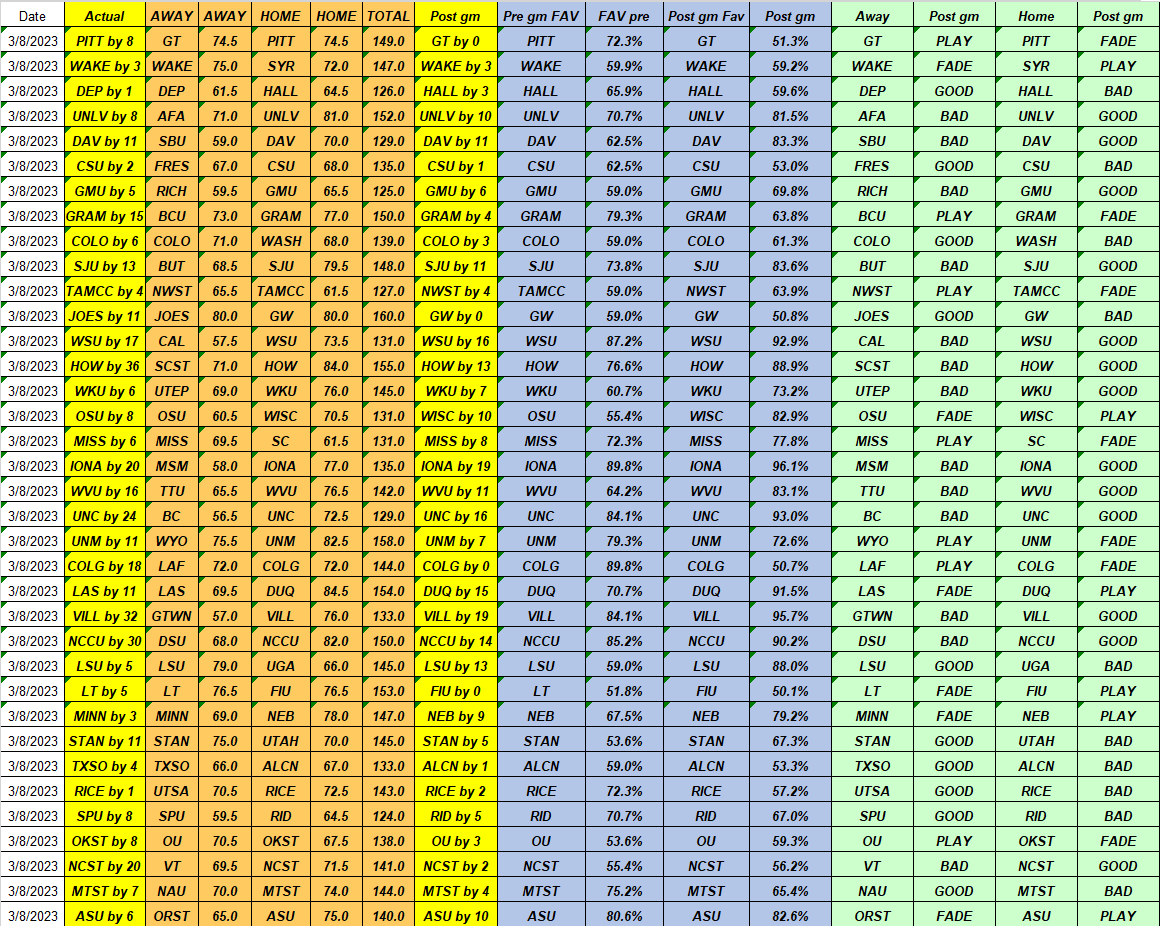
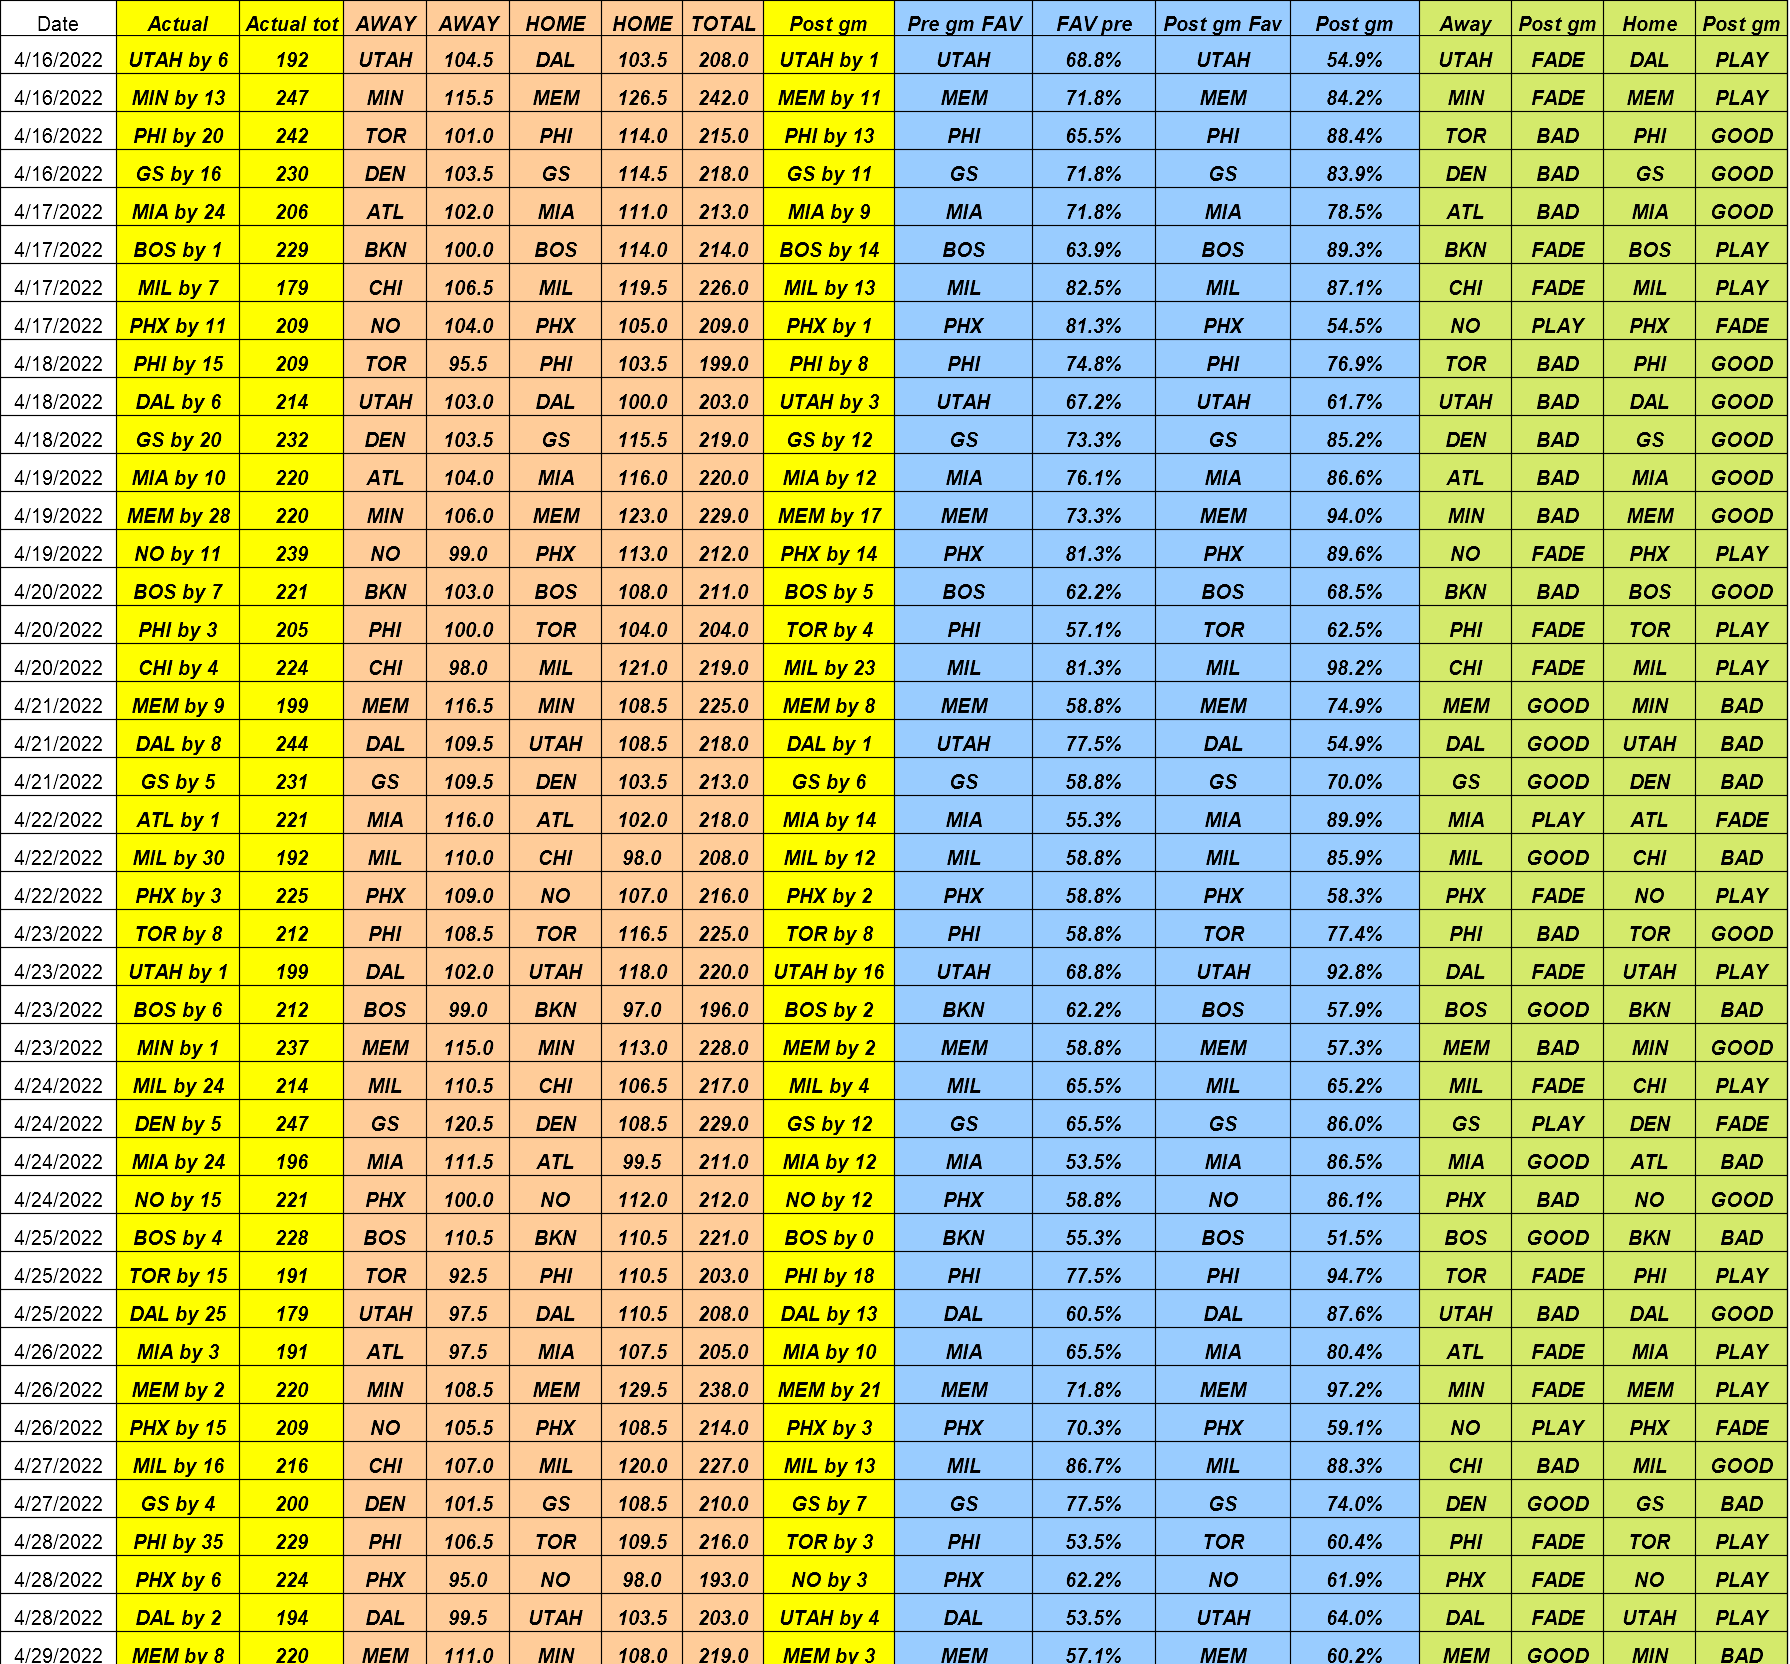
Here are post game win percentages and scores for Men’s NCAA Basketball conference tournament games based on pre-game market expectations versus what actually happened in the game. Post game numbers are based everything in the box score. Taking into account pre-game stat expectations for each team and comparing them to actual results using a regression method of analyzing how each team took advantage of their possessions in the game.
The chart below is taking a look at the previous game’s box scores and generates a new final score based on who may have overachieved or underachieved based on stats. The program generates an “expected” margin of victory, using actual final game stats, and compares that to the pre game expectation. The last part of the chart simplifies the pre-market projections against what the post game winning margin would suggest. Gives you an idea if teams “should” have won and covered the spread or if the final was mis-leading.
Good—Played as they were projected to do in the game. They covered the spread and the post game winning margin also covered the spread.
Bad—Played below expectations for the game. They didn’t cover the spread and the post game winning margin also didn’t cover the spread.
Fade—Exceeded expectations based on their actual stats vs. pre game chances for the game. They covered the spread but post game win numbers suggest they overachieved and may play worse the next game.
Play—Played worse than expected based on their actual stats vs. pre game chances for the game. They did not cover the spread but post game win numbers suggest they should play better next time.
(Good/Bad/Fade/Play are just suggestions to look at as a guide.