
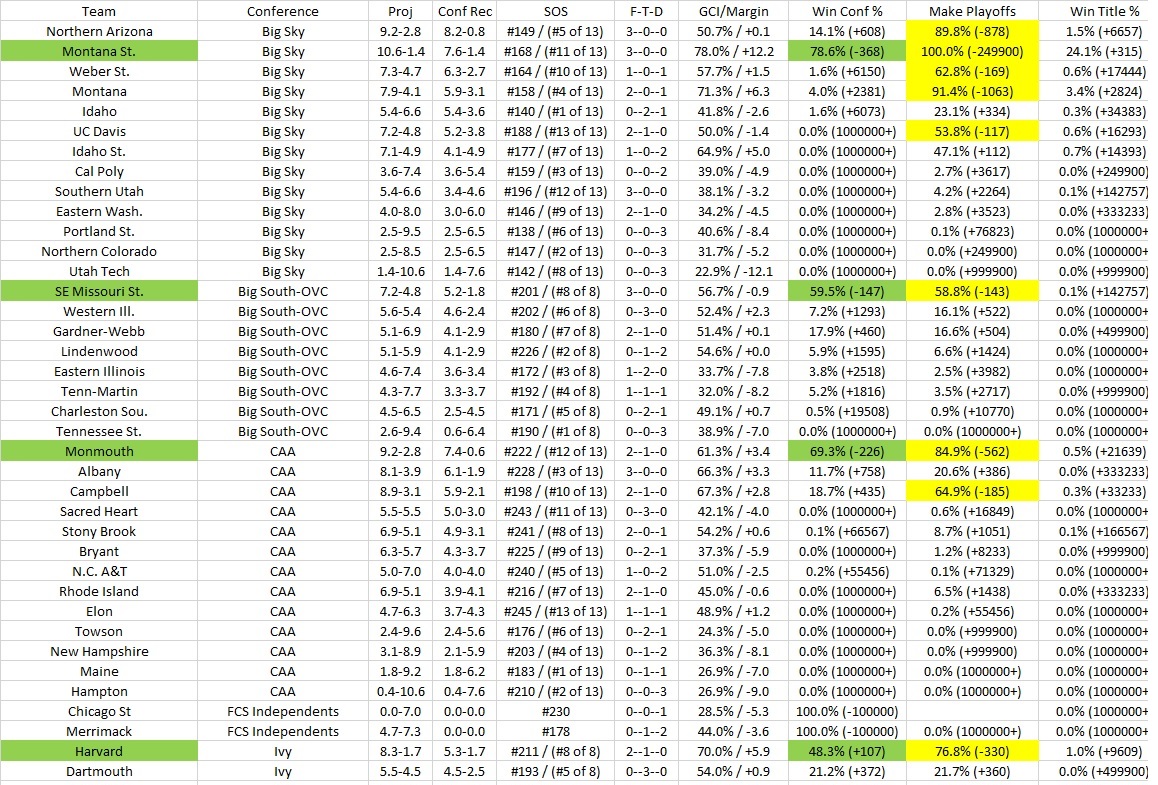
Below are projected standings and chances of each team winning their conference and making the playoffs. Right now auto bid projections are:
- Big Sky — Montana State
- CAA — Monmouth
- Ivy — Harvard
- MVFC — South Dakota St.
- NEC — Central Connecticut State
- OVC — Southeast Missouri State
- Patriot — Lehigh
- Pioneer — Dayton
- SoCon — Tennessee Tech
- Southland — Stephen F. Austin
- UAC — Tarleton State
- At large teams (showing >50% odds to currently make playoff: Northern Arizona, UC Davis, Montana, Weber St., Campbell, Youngstown St., South Dakota, North Dakota, Illinois St, Lamar and Austin Peay.
- Still room for two more teams based on only 22 teams currently selected. Going to be fun watching the last few weeks to see which teams finish the season well.
Headings explained: SOS is listed as OVERALL then if in conference their rank of games against just conference opponents. For example 6/8. GCI index/Margin is how long you held the lead in games and the average margin of that lead. F-T-D = games left as a favorite, tossups, dogs.
| Team | Conference | Proj | Conf Rec | SOS | F-T-D | GCI/Margin | Win Conf % | Make Playoffs | Win Title % |
| Northern Arizona | Big Sky | 9.2-2.8 | 8.2-0.8 | #149 / (#5 of 13) | 3–0–0 | 50.7% / +0.1 | 14.1% (+608) | 89.8% (-878) | 1.5% (+6657) |
| Montana St. | Big Sky | 10.6-1.4 | 7.6-1.4 | #168 / (#11 of 13) | 3–0–0 | 78.0% / +12.2 | 78.6% (-368) | 100.0% (-249900) | 24.1% (+315) |
| Weber St. | Big Sky | 7.3-4.7 | 6.3-2.7 | #164 / (#10 of 13) | 1–0–1 | 57.7% / +1.5 | 1.6% (+6150) | 62.8% (-169) | 0.6% (+17444) |
| Montana | Big Sky | 7.9-4.1 | 5.9-3.1 | #158 / (#4 of 13) | 2–0–1 | 71.3% / +6.3 | 4.0% (+2381) | 91.4% (-1063) | 3.4% (+2824) |
| Idaho | Big Sky | 5.4-6.6 | 5.4-3.6 | #140 / (#1 of 13) | 0–2–1 | 41.8% / -2.6 | 1.6% (+6073) | 23.1% (+334) | 0.3% (+34383) |
| UC Davis | Big Sky | 7.2-4.8 | 5.2-3.8 | #188 / (#13 of 13) | 2–1–0 | 50.0% / -1.4 | 0.0% (1000000+) | 53.8% (-117) | 0.6% (+16293) |
| Idaho St. | Big Sky | 7.1-4.9 | 4.1-4.9 | #177 / (#7 of 13) | 1–0–2 | 64.9% / +5.0 | 0.0% (1000000+) | 47.1% (+112) | 0.7% (+14393) |
| Cal Poly | Big Sky | 3.6-7.4 | 3.6-5.4 | #159 / (#3 of 13) | 0–0–2 | 39.0% / -4.9 | 0.0% (1000000+) | 2.7% (+3617) | 0.0% (+249900) |
| Southern Utah | Big Sky | 5.4-6.6 | 3.4-4.6 | #196 / (#12 of 13) | 3–0–0 | 38.1% / -3.2 | 0.0% (1000000+) | 4.2% (+2264) | 0.1% (+142757) |
| Eastern Wash. | Big Sky | 4.0-8.0 | 3.0-6.0 | #146 / (#9 of 13) | 2–1–0 | 34.2% / -4.5 | 0.0% (1000000+) | 2.8% (+3523) | 0.0% (+333233) |
| Portland St. | Big Sky | 2.5-9.5 | 2.5-6.5 | #138 / (#6 of 13) | 0–0–3 | 40.6% / -8.4 | 0.0% (1000000+) | 0.1% (+76823) | 0.0% (1000000+) |
| Northern Colorado | Big Sky | 2.5-8.5 | 2.5-6.5 | #147 / (#2 of 13) | 0–0–3 | 31.7% / -5.2 | 0.0% (1000000+) | 0.0% (+249900) | 0.0% (1000000+) |
| Utah Tech | Big Sky | 1.4-10.6 | 1.4-7.6 | #142 / (#8 of 13) | 0–0–3 | 22.9% / -12.1 | 0.0% (1000000+) | 0.0% (+999900) | 0.0% (+999900) |
| SE Missouri St. | Big South-OVC | 7.2-4.8 | 5.2-1.8 | #201 / (#8 of 8) | 3–0–0 | 56.7% / -0.9 | 59.5% (-147) | 58.8% (-143) | 0.1% (+142757) |
| Western Ill. | Big South-OVC | 5.6-5.4 | 4.6-2.4 | #202 / (#6 of 8) | 0–3–0 | 52.4% / +2.3 | 7.2% (+1293) | 16.1% (+522) | 0.0% (1000000+) |
| Gardner-Webb | Big South-OVC | 5.1-6.9 | 4.1-2.9 | #180 / (#7 of 8) | 2–1–0 | 51.4% / +0.1 | 17.9% (+460) | 16.6% (+504) | 0.0% (+499900) |
| Lindenwood | Big South-OVC | 5.1-5.9 | 4.1-2.9 | #226 / (#2 of 8) | 0–1–2 | 54.6% / +0.0 | 5.9% (+1595) | 6.6% (+1424) | 0.0% (1000000+) |
| Eastern Illinois | Big South-OVC | 4.6-7.4 | 3.6-3.4 | #172 / (#3 of 8) | 1–2–0 | 33.7% / -7.8 | 3.8% (+2518) | 2.5% (+3982) | 0.0% (1000000+) |
| Tenn-Martin | Big South-OVC | 4.3-7.7 | 3.3-3.7 | #192 / (#4 of 8) | 1–1–1 | 32.0% / -8.2 | 5.2% (+1816) | 3.5% (+2717) | 0.0% (+999900) |
| Charleston Sou. | Big South-OVC | 4.5-6.5 | 2.5-4.5 | #171 / (#5 of 8) | 0–2–1 | 49.1% / +0.7 | 0.5% (+19508) | 0.9% (+10770) | 0.0% (1000000+) |
| Tennessee St. | Big South-OVC | 2.6-9.4 | 0.6-6.4 | #190 / (#1 of 8) | 0–0–3 | 38.9% / -7.0 | 0.0% (1000000+) | 0.0% (1000000+) | 0.0% (1000000+) |
| Monmouth | CAA | 9.2-2.8 | 7.4-0.6 | #222 / (#12 of 13) | 2–1–0 | 61.3% / +3.4 | 69.3% (-226) | 84.9% (-562) | 0.5% (+21639) |
| Albany | CAA | 8.1-3.9 | 6.1-1.9 | #228 / (#3 of 13) | 3–0–0 | 66.3% / +3.3 | 11.7% (+758) | 20.6% (+386) | 0.0% (+333233) |
| Campbell | CAA | 8.9-3.1 | 5.9-2.1 | #198 / (#10 of 13) | 2–1–0 | 67.3% / +2.8 | 18.7% (+435) | 64.9% (-185) | 0.3% (+33233) |
| Sacred Heart | CAA | 5.5-5.5 | 5.0-3.0 | #243 / (#11 of 13) | 0–3–0 | 42.1% / -4.0 | 0.0% (1000000+) | 0.6% (+16849) | 0.0% (1000000+) |
| Stony Brook | CAA | 6.9-5.1 | 4.9-3.1 | #241 / (#8 of 13) | 2–0–1 | 54.2% / +0.6 | 0.1% (+66567) | 8.7% (+1051) | 0.1% (+166567) |
| Bryant | CAA | 6.3-5.7 | 4.3-3.7 | #225 / (#9 of 13) | 0–2–1 | 37.3% / -5.9 | 0.0% (1000000+) | 1.2% (+8233) | 0.0% (+999900) |
| N.C. A&T | CAA | 5.0-7.0 | 4.0-4.0 | #240 / (#5 of 13) | 1–0–2 | 51.0% / -2.5 | 0.2% (+55456) | 0.1% (+71329) | 0.0% (1000000+) |
| Rhode Island | CAA | 6.9-5.1 | 3.9-4.1 | #216 / (#7 of 13) | 2–1–0 | 45.0% / -0.6 | 0.0% (1000000+) | 6.5% (+1438) | 0.0% (+333233) |
| Elon | CAA | 4.7-6.3 | 3.7-4.3 | #245 / (#13 of 13) | 1–1–1 | 48.9% / +1.2 | 0.0% (1000000+) | 0.2% (+55456) | 0.0% (1000000+) |
| Towson | CAA | 2.4-9.6 | 2.4-5.6 | #176 / (#6 of 13) | 0–2–1 | 24.3% / -5.0 | 0.0% (1000000+) | 0.0% (+999900) | 0.0% (1000000+) |
| New Hampshire | CAA | 3.1-8.9 | 2.1-5.9 | #203 / (#4 of 13) | 0–1–2 | 36.3% / -8.1 | 0.0% (1000000+) | 0.0% (+999900) | 0.0% (1000000+) |
| Maine | CAA | 1.8-9.2 | 1.8-6.2 | #183 / (#1 of 13) | 0–1–1 | 26.9% / -7.0 | 0.0% (1000000+) | 0.0% (1000000+) | 0.0% (1000000+) |
| Hampton | CAA | 0.4-10.6 | 0.4-7.6 | #210 / (#2 of 13) | 0–0–3 | 26.9% / -9.0 | 0.0% (1000000+) | 0.0% (1000000+) | 0.0% (1000000+) |
| Chicago St | FCS Independents | 0.0-7.0 | 0.0-0.0 | #230 | 0–0–1 | 28.5% / -5.3 | 100.0% (-100000) | 0.0% (1000000+) | |
| Merrimack | FCS Independents | 4.7-7.3 | 0.0-0.0 | #178 | 0–1–2 | 44.0% / -3.6 | 100.0% (-100000) | 0.0% (1000000+) | 0.0% (1000000+) |
| Harvard | Ivy | 8.3-1.7 | 5.3-1.7 | #211 / (#8 of 8) | 2–1–0 | 70.0% / +5.9 | 48.3% (+107) | 76.8% (-330) | 1.0% (+9609) |
| Dartmouth | Ivy | 5.5-4.5 | 4.5-2.5 | #193 / (#5 of 8) | 0–3–0 | 54.0% / +0.9 | 21.2% (+372) | 21.7% (+360) | 0.0% (+499900) |
| Princeton | Ivy | 6.4-3.6 | 4.4-2.6 | #221 / (#3 of 8) | 0–2–1 | 62.2% / +3.8 | 7.1% (+1308) | 9.8% (+922) | 0.0% (+499900) |
| Yale | Ivy | 5.9-4.1 | 3.9-3.1 | #212 / (#7 of 8) | 2–1–0 | 50.8% / +0.1 | 21.8% (+359) | 27.8% (+259) | 0.2% (+43378) |
| Brown | Ivy | 5.5-4.5 | 3.5-3.5 | #220 / (#6 of 8) | 1–1–1 | 51.9% / +1.7 | 1.6% (+5998) | 3.1% (+3126) | 0.0% (+999900) |
| Cornell | Ivy | 4.8-5.2 | 2.8-4.2 | #195 / (#4 of 8) | 2–1–0 | 68.2% / +2.9 | 0.0% (+999900) | 0.9% (+10538) | 0.0% (1000000+) |
| Pennsylvania | Ivy | 4.0-6.0 | 2.0-5.0 | #204 / (#2 of 8) | 0–1–2 | 38.9% / -1.5 | 0.0% (+999900) | 0.2% (+47519) | 0.0% (+999900) |
| Columbia | Ivy | 4.8-5.2 | 1.8-5.2 | #217 / (#1 of 8) | 0–0–3 | 34.5% / -4.6 | 0.0% (1000000+) | 0.5% (+20733) | 0.0% (1000000+) |
| S. Carolina St. | MEAC | 7.3-2.7 | 4.3-0.7 | #246 / (#6 of 6) | 3–0–0 | 80.4% / +13.3 | 68.0% (-213) | 0.0% (1000000+) | |
| N.C. Central | MEAC | 4.5-6.5 | 3.5-1.5 | #231 / (#5 of 6) | 2–0–1 | 58.0% / +1.2 | 23.8% (+319) | 0.0% (1000000+) | |
| Delaware St. | MEAC | 4.4-5.6 | 2.4-2.6 | #208 / (#4 of 6) | 0–2–1 | 38.3% / -4.4 | 4.7% (+2037) | 0.0% (1000000+) | |
| Howard | MEAC | 4.1-6.9 | 2.1-2.9 | #175 / (#2 of 6) | 0–2–1 | 30.8% / -9.7 | 3.2% (+3045) | 0.0% (1000000+) | |
| Morgan St. | MEAC | 5.4-5.6 | 1.4-3.6 | #229 / (#3 of 6) | 1–1–1 | 45.6% / -2.4 | 0.2% (+45355) | 0.0% (1000000+) | |
| Norfolk St. | MEAC | 3.3-6.7 | 1.3-3.7 | #237 / (#1 of 6) | 0–1–2 | 53.3% / +3.6 | 0.1% (+199900) | 0.0% (1000000+) | |
| South Dakota St. | MVFC | 9.7-2.3 | 6.7-1.3 | #166 / (#9 of 9) | 3–0–0 | 72.8% / +12.6 | 81.0% (-427) | 99.6% (-23710) | 17.7% (+465) |
| Youngstown St. | MVFC | 8.6-2.4 | 6.6-1.4 | #151 / (#8 of 9) | 2–0–0 | 58.3% / +6.8 | 17.7% (+465) | 98.9% (-8909) | 7.4% (+1250) |
| South Dakota | MVFC | 8.3-3.7 | 5.3-2.7 | #148 / (#7 of 9) | 1–1–0 | 66.6% / +6.9 | 0.0% (+333233) | 93.3% (-1390) | 4.1% (+2327) |
| Illinois St. | MVFC | 7.4-3.6 | 4.4-3.6 | #155 / (#6 of 9) | 0–2–1 | 71.9% / +12.1 | 0.3% (+31150) | 83.6% (-511) | 3.8% (+2546) |
| North Dakota | MVFC | 7.3-4.7 | 4.3-3.7 | #153 / (#5 of 9) | 1–1–0 | 63.3% / +6.3 | 0.0% (1000000+) | 78.2% (-359) | 3.0% (+3267) |
| Northern Iowa | MVFC | 5.1-5.9 | 4.1-3.9 | #143 / (#3 of 9) | 1–0–2 | 55.0% / -1.1 | 0.9% (+10889) | 11.7% (+758) | 0.2% (+62400) |
| Southern Ill. | MVFC | 5.1-6.9 | 3.1-4.9 | #144 / (#4 of 9) | 1–0–2 | 38.6% / -3.7 | 0.0% (1000000+) | 9.3% (+974) | 0.1% (+66567) |
| Indiana St. | MVFC | 3.2-8.8 | 1.2-6.8 | #150 / (#2 of 9) | 1–0–2 | 32.8% / -5.4 | 0.0% (1000000+) | 0.1% (+76823) | 0.0% (1000000+) |
| Murray St. | MVFC | 1.4-10.6 | 0.4-7.6 | #141 / (#1 of 9) | 0–0–3 | 27.4% / -11.1 | 0.0% (1000000+) | 0.0% (1000000+) | 0.0% (1000000+) |
| Central Conn. St. | NEC | 5.9-4.1 | 5.9-1.1 | #238 / (#8 of 8) | 2–1–0 | 61.8% / +3.9 | 53.3% (-114) | 54.4% (-119) | 0.0% (1000000+) |
| Stonehill | NEC | 5.7-6.3 | 4.7-2.3 | #250 / (#7 of 8) | 1–2–0 | 51.0% / +0.5 | 18.2% (+449) | 19.2% (+420) | 0.0% (1000000+) |
| Duquesne | NEC | 4.5-5.5 | 4.5-2.5 | #233 / (#6 of 8) | 1–1–1 | 46.4% / -5.3 | 15.2% (+560) | 14.8% (+575) | 0.0% (1000000+) |
| Long Island | NEC | 4.4-7.6 | 4.4-2.6 | #224 / (#4 of 8) | 0–2–1 | 21.0% / -10.2 | 10.7% (+833) | 10.2% (+880) | 0.0% (1000000+) |
| Robert Morris | NEC | 4.5-6.5 | 3.5-3.5 | #253 / (#5 of 8) | 0–3–0 | 57.9% / -0.7 | 2.5% (+3822) | 1.5% (+6611) | 0.0% (1000000+) |
| New Haven | NEC | 3.3-8.7 | 2.3-4.7 | #247 / (#2 of 8) | 0–2–1 | 14.7% / -11.6 | 0.0% (1000000+) | 0.0% (1000000+) | 0.0% (1000000+) |
| Mercyhurst | NEC | 1.7-9.3 | 1.7-5.3 | #213 / (#3 of 8) | 2–0–1 | 26.9% / -11.5 | 0.0% (1000000+) | 0.0% (1000000+) | |
| Wagner | NEC | 1.0-10.0 | 1.0-6.0 | #234 / (#1 of 8) | 0–1–2 | 25.7% / -11.9 | 0.0% (1000000+) | 0.0% (1000000+) | 0.0% (1000000+) |
| Lehigh | Patriot | 9.3-2.7 | 7.3-1.7 | #235 / (#10 of 10) | 3–0–0 | 65.4% / +7.1 | 60.2% (-152) | 80.1% (-402) | 1.5% (+6657) |
| Villanova | Patriot | 7.1-4.9 | 6.1-2.9 | #207 / (#8 of 10) | 3–0–0 | 59.8% / +2.0 | 10.8% (+828) | 25.2% (+297) | 0.1% (+71329) |
| Colgate | Patriot | 6.9-5.1 | 5.9-3.1 | #209 / (#9 of 10) | 2–0–1 | 76.2% / +8.0 | 18.7% (+436) | 22.7% (+340) | 0.1% (+166567) |
| Holy Cross | Patriot | 5.8-6.2 | 5.8-3.2 | #197 / (#6 of 10) | 2–0–1 | 41.5% / -3.8 | 1.7% (+5888) | 2.3% (+4286) | 0.0% (+999900) |
| Richmond | Patriot | 7.4-4.6 | 5.4-3.6 | #205 / (#7 of 10) | 1–0–2 | 66.0% / -0.4 | 8.3% (+1112) | 18.6% (+439) | 0.0% (+499900) |
| Georgetown | Patriot | 4.5-6.5 | 4.5-4.5 | #227 / (#3 of 10) | 0–2–2 | 30.0% / -5.6 | 0.4% (+25541) | 0.3% (+30203) | 0.0% (1000000+) |
| Lafayette | Patriot | 4.3-7.7 | 3.3-5.7 | #218 / (#5 of 10) | 0–2–2 | 34.1% / -6.7 | 0.0% (1000000+) | 0.2% (+52532) | 0.0% (+999900) |
| Fordham | Patriot | 3.2-8.8 | 3.2-5.8 | #179 / (#2 of 10) | 0–2–1 | 28.7% / -7.6 | 0.0% (1000000+) | 0.0% (1000000+) | 0.0% (1000000+) |
| William & Mary | Patriot | 4.5-7.5 | 2.5-6.5 | #199 / (#4 of 10) | 1–1–1 | 29.1% / -10.6 | 0.0% (1000000+) | 0.1% (+124900) | 0.0% (1000000+) |
| Bucknell | Patriot | 2.0-10.0 | 1.0-8.0 | #214 / (#1 of 10) | 0–1–2 | 22.0% / -9.3 | 0.0% (1000000+) | 0.0% (1000000+) | 0.0% (1000000+) |
| Dayton | Pioneer | 7.6-1.4 | 6.6-1.4 | #266 / (#11 of 11) | 3–0–0 | 71.1% / +5.8 | 60.3% (-152) | 53.3% (-114) | 0.0% (1000000+) |
| Butler | Pioneer | 7.0-3.0 | 6.0-2.0 | #259 / (#1 of 11) | 1–2–0 | 61.3% / +5.8 | 11.5% (+770) | 12.1% (+726) | 0.0% (1000000+) |
| St. Thomas | Pioneer | 7.0-3.0 | 6.0-2.0 | #260 / (#9 of 11) | 2–1–0 | 65.3% / +6.5 | 24.3% (+311) | 31.6% (+216) | 0.0% (1000000+) |
| Marist | Pioneer | 5.2-5.8 | 5.2-2.8 | #265 / (#10 of 11) | 2–1–0 | 60.0% / +2.9 | 2.4% (+4102) | 2.4% (+4049) | 0.0% (1000000+) |
| San Diego | Pioneer | 5.5-5.5 | 4.5-3.5 | #255 / (#4 of 11) | 1–1–0 | 43.9% / -4.1 | 0.0% (1000000+) | 0.0% (+999900) | 0.0% (1000000+) |
| Valparaiso | Pioneer | 4.2-5.8 | 4.2-3.8 | #263 / (#3 of 11) | 1–0–2 | 51.7% / +2.5 | 1.5% (+6657) | 1.4% (+7146) | 0.0% (1000000+) |
| Presbyterian | Pioneer | 3.7-6.3 | 3.7-4.3 | #261 / (#7 of 11) | 0–1–1 | 39.6% / -6.2 | 0.0% (1000000+) | 0.0% (1000000+) | 0.0% (1000000+) |
| Drake | Pioneer | 3.6-6.4 | 3.6-4.4 | #256 / (#2 of 11) | 0–1–1 | 47.9% / -2.0 | 0.0% (1000000+) | 0.0% (1000000+) | 0.0% (1000000+) |
| Morehead St. | Pioneer | 1.6-8.4 | 1.6-6.4 | #262 / (#8 of 11) | 0–1–2 | 36.0% / -4.8 | 0.0% (1000000+) | 0.0% (1000000+) | 0.0% (1000000+) |
| Davidson | Pioneer | 2.6-7.4 | 1.6-6.4 | #264 / (#5 of 11) | 0–1–2 | 27.5% / -9.6 | 0.0% (1000000+) | 0.0% (1000000+) | 0.0% (1000000+) |
| Stetson | Pioneer | 0.9-10.1 | 0.9-7.1 | #258 / (#6 of 11) | 0–1–2 | 19.9% / -14.4 | 0.0% (1000000+) | 0.0% (1000000+) | 0.0% (1000000+) |
| Tennessee Tech | Southern | 9.8-2.2 | 7.7-0.3 | #189 / (#10 of 10) | 2–0–1 | 64.6% / +5.6 | 74.4% (-291) | 96.9% (-3126) | 3.3% (+2921) |
| Chattanooga | Southern | 7.0-5.0 | 6.0-2.0 | #173 / (#9 of 10) | 0–2–1 | 61.1% / +4.0 | 6.7% (+1390) | 15.7% (+536) | 0.1% (+199900) |
| East Tennessee State | Southern | 6.8-4.2 | 5.8-2.2 | #182 / (#5 of 10) | 1–2–0 | 64.7% / +4.5 | 6.8% (+1368) | 32.2% (+210) | 0.2% (+58724) |
| Mercer | Southern | 8.4-3.6 | 5.4-2.6 | #206 / (#7 of 10) | 0–2–1 | 65.9% / +7.0 | 12.1% (+729) | 47.0% (+113) | 0.3% (+29312) |
| Western Carolina | Southern | 6.0-6.0 | 4.0-4.0 | #174 / (#1 of 10) | 3–0–0 | 50.8% / -2.1 | 0.0% (1000000+) | 12.2% (+722) | 0.1% (+166567) |
| Wofford | Southern | 5.8-6.2 | 3.8-4.2 | #169 / (#7 of 10) | 0–1–2 | 73.1% / +4.6 | 0.0% (1000000+) | 8.5% (+1079) | 0.0% (+333233) |
| Samford | Southern | 3.5-8.5 | 3.5-4.5 | #157 / (#3 of 10) | 0–0–3 | 31.4% / -3.8 | 0.0% (1000000+) | 0.0% (1000000+) | 0.0% (1000000+) |
| Furman | Southern | 3.0-8.0 | 3.0-5.0 | #170 / (#5 of 10) | 1–2–0 | 17.3% / -6.8 | 0.0% (1000000+) | 0.0% (1000000+) | 0.0% (1000000+) |
| Citadel | Southern | 3.7-8.3 | 1.7-6.3 | #162 / (#3 of 10) | 1–1–1 | 33.0% / -6.1 | 0.0% (1000000+) | 0.1% (+111011) | 0.0% (1000000+) |
| Virginia Military | Southern | 0.1-11.9 | 0.1-7.9 | #186 / (#1 of 10) | 0–0–3 | 19.7% / -14.9 | 0.0% (1000000+) | 0.0% (1000000+) | 0.0% (1000000+) |
| Stephen F. Austin | Southland | 10.6-0.4 | 8.6-0.4 | #223 / (#10 of 10) | 3–0–0 | 92.3% / +16.5 | 79.0% (-376) | 99.8% (-55456) | 11.8% (+746) |
| Lamar | Southland | 8.9-3.1 | 6.9-2.1 | #191 / (#9 of 10) | 2–0–1 | 74.8% / +7.6 | 21.0% (+376) | 79.7% (-392) | 1.1% (+9424) |
| Incarnate Word | Southland | 6.2-4.8 | 6.2-2.8 | #181 / (#8 of 10) | 2–1–0 | 56.2% / +7.2 | 0.0% (1000000+) | 30.0% (+234) | 0.3% (+36937) |
| Houston Christian | Southland | 4.8-6.2 | 4.8-4.2 | #167 / (#4 of 10) | 1–1–1 | 40.9% / +1.0 | 0.0% (1000000+) | 0.8% (+13233) | 0.0% (+999900) |
| SE Louisiana | Southland | 6.0-6.0 | 4.0-5.0 | #194 / (#7 of 10) | 2–1–0 | 49.7% / +0.6 | 0.0% (1000000+) | 17.2% (+483) | 0.1% (+124900) |
| East Texas A&M | Southland | 3.9-8.1 | 3.9-5.1 | #184 / (#3 of 10) | 0–1–2 | 35.5% / -5.1 | 0.0% (1000000+) | 0.0% (+249900) | 0.0% (1000000+) |
| McNeese St. | Southland | 3.9-7.1 | 3.9-5.1 | #156 / (#5 of 10) | 0–1–2 | 43.0% / -3.2 | 0.0% (1000000+) | 0.4% (+24290) | 0.0% (+999900) |
| Texas Rio Grande Valley | Southland | 4.7-6.3 | 3.7-5.3 | #187 / (#6 of 10) | 2–0–1 | 38.7% / -3.0 | 0.0% (1000000+) | 1.5% (+6523) | 0.0% (+999900) |
| Nicholls St. | Southland | 3.7-8.3 | 2.7-6.3 | #185 / (#2 of 10) | 0–1–2 | 30.9% / -10.8 | 0.0% (1000000+) | 0.0% (+249900) | 0.0% (1000000+) |
| Northwestern St. | Southland | 0.2-10.8 | 0.2-8.8 | #163 / (#1 of 10) | 0–0–3 | 19.4% / -17.6 | 0.0% (1000000+) | 0.0% (1000000+) | 0.0% (1000000+) |
| Alabama A&M | SWAC | 7.2-2.8 | 6.2-1.8 | #254 / (#9 of 12) | 2–1–0 | 86.4% / +12.3 | 45.9% (+118) | 0.0% (1000000+) | |
| Jackson St. | SWAC | 6.1-2.9 | 5.1-2.9 | #257 / (#10 of 12) | 2–1–0 | 60.6% / +6.6 | 17.2% (+481) | 0.0% (1000000+) | |
| Prairie View A&M | SWAC | 5.8-6.2 | 4.8-3.2 | #219 / (#11 of 12) | 1–2–0 | 52.5% / -1.1 | 15.5% (+546) | 0.0% (1000000+) | |
| Alcorn St. | SWAC | 4.7-5.3 | 4.7-3.3 | #251 / (#12 of 12) | 2–0–1 | 55.8% / +4.6 | 8.4% (+1096) | 0.0% (1000000+) | |
| Bethune-Cookman | SWAC | 5.7-5.3 | 4.7-3.3 | #248 / (#8 of 12) | 0–3–0 | 46.7% / -6.7 | 5.8% (+1621) | 0.0% (1000000+) | |
| AR Pine Bluff | SWAC | 4.3-4.7 | 4.3-3.7 | #242 / (#7 of 12) | 0–2–1 | 64.3% / +5.8 | 3.2% (+3006) | 0.0% (1000000+) | |
| Grambling St. | SWAC | 3.7-5.3 | 3.7-4.3 | #236 / (#1 of 12) | 1–2–0 | 51.8% / -0.1 | 0.9% (+10653) | 0.0% (1000000+) | |
| Alabama St. | SWAC | 4.6-5.4 | 3.6-4.4 | #252 / (#6 of 12) | 1–2–0 | 48.3% / +1.5 | 2.8% (+3421) | 0.0% (1000000+) | |
| Southern | SWAC | 3.1-6.9 | 3.1-4.9 | #239 / (#3 of 12) | 0–1–2 | 48.9% / -3.5 | 0.2% (+49900) | 0.0% (1000000+) | |
| Texas Southern | SWAC | 3.9-7.1 | 2.9-5.1 | #244 / (#5 of 12) | 0–1–2 | 33.1% / -9.5 | 0.1% (+124900) | 0.0% (1000000+) | |
| Florida A&M | SWAC | 2.6-8.4 | 2.6-5.4 | #232 / (#4 of 12) | 1–1–1 | 34.9% / -9.5 | 0.0% (1000000+) | 0.0% (1000000+) | |
| Miss. Valley St. | SWAC | 2.3-7.7 | 2.3-5.7 | #249 / (#2 of 12) | 0–0–3 | 23.9% / -12.6 | 0.0% (1000000+) | 0.0% (1000000+) | |
| Tarleton State | UAC | 11.5-0.5 | 6.5-0.5 | #215 / (#8 of 8) | 3–0–0 | 84.6% / +9.7 | 85.4% (-587) | 99.9% (-71329) | 8.5% (+1071) |
| Austin Peay | UAC | 9.4-2.6 | 5.4-1.6 | #200 / (#7 of 8) | 3–0–0 | 60.1% / +6.3 | 4.7% (+2010) | 90.3% (-935) | 2.3% (+4267) |
| Abilene Christian | UAC | 6.2-5.8 | 5.2-1.8 | #145 / (#6 of 8) | 1–0–2 | 48.1% / +1.9 | 9.7% (+931) | 21.6% (+362) | 0.3% (+39900) |
| North Alabama | UAC | 6.6-5.4 | 3.6-3.4 | #165 / (#5 of 8) | 2–0–1 | 55.7% / +0.5 | 0.1% (+166567) | 9.3% (+976) | 0.1% (+199900) |
| Eastern Kentucky | UAC | 3.9-8.1 | 2.9-4.1 | #160 / (#2 of 8) | 0–1–2 | 39.2% / -5.7 | 0.1% (+166567) | 0.5% (+21639) | 0.0% (+999900) |
| West Florida | UAC | 4.1-4.9 | 2.1-4.9 | #161 / (#4 of 8) | 1–0–2 | 52.0% / +1.3 | 0.0% (1000000+) | 0.0% (1000000+) | |
| Central Arkansas | UAC | 2.4-8.6 | 1.4-5.6 | #154 / (#3 of 8) | 1–1–1 | 26.4% / -4.7 | 0.0% (1000000+) | 0.0% (+333233) | 0.0% (1000000+) |
| West Georgia | UAC | 1.0-10.0 | 1.0-6.0 | #152 / (#1 of 8) | 0–0–3 | 30.6% / -8.8 | 0.0% (1000000+) | 0.0% (1000000+) |